Standard deviations formula with examples
standard deviations is a measure of how spread out data is. It is calculated as the square
root of the variance. The standard deviation formula is used to find out how much variation there is
from the mean, or average, value in a set of data. This article will show you how to calculate the
standard deviation with examples.
What is Standard Deviations?
Standard deviations is a statistical measure of how spread out data is. It is calculated as the square root
of the variance. The variance is the average of the squared differences from the mean. The standard
deviation can be used to calculate how likely it is that a given data point will fall within a certain range of
values.
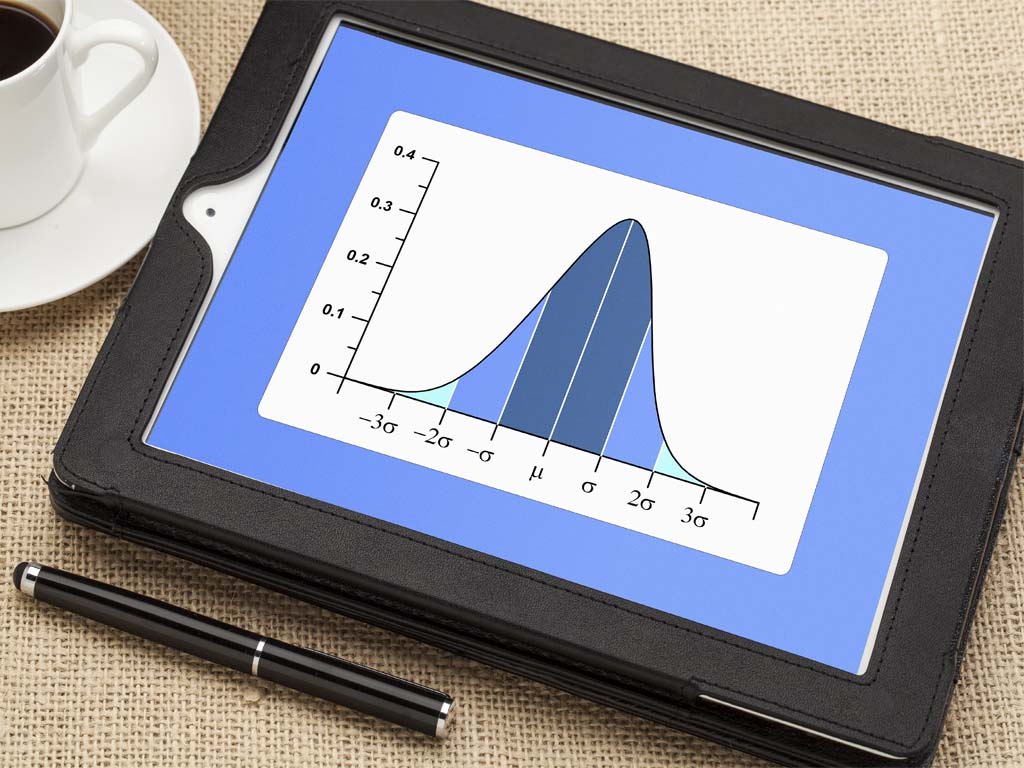
For example, if the standard deviation of a set of data is 2, then 68% of the data points will fall within 1
standard deviation (±1) of the mean, 95% will fall within 2 standard deviations (±2), and 99.7% will fall
within 3 standard deviations (±3).
The standard deviation can also be used to find outliers in data sets. An outlier is a data point that falls
outside of the expected range. Data points that are more than 3 standard deviations from the mean are
considered outliers.
The formula for Standard Deviation
Standard deviation is a statistical measure of how much variation exists within a set of data. The formula
for calculating standard deviation is:
σ = √Σ((x-μ)^2)/N
where μ is the mean of the data set, x is each data point, and N is the number of data points
in the set.
An example of how to use this formula can be seen by looking at the following set of data points: 1, 2, 3,
4, 5. The mean of this set is 3 ((1+2+3+4+5)/5), so plugging that into the formula above gives us:
σ = √Σ((x-3)^2)/5
Now we need to take each data point and subtract 3 from it, then square that result and
divide it by 5. This gives us:
σ = √(1/5)*((1-3)^2 + (2-3)^2 + (3-3)^2 + (4-3)^2 + (5-3)^2)
How to Calculate Standard Deviations
When it comes to statistics, the standard deviation is a key metric that helps to measure the spread of data.
In other words, it tells you how much variation there is in a dataset. While the concept might sound
complicated, the standard deviation formula is quite simple. In this blog post, we’ ll walk you
through the standard deviation formula and provide some examples to help you better understand how
it works.
To calculate the standard deviation, you first need to find the mean of your data set. Once you have the
mean, simply subtract it from each data point and square the result. Then, take the average of all of the
squared results. This will give you the variance. To find the standard deviation, simply take the square
root of the variance.
Let’s look at an example to see how this works in practice. Suppose we have a data set consisting of the
following values: 1, 2, 3, 4, 5. The mean of this data set is 3 (calculated by adding all values together and
then dividing by 5). To find the variance, we subtract 3 from each value and square the result:
1: (-2)^2 = 4
2: (-1)^2 = 1
Standard Deviation Examples
Standard deviations is a statistical measure of how much variation exists within a set of data. It’s used to
quantify the spread of values in a data set, and it provides a way to compare data sets that have
different means. The formula for standard deviation can be intimidating, but once you understand it, it’s
not so bad. This blog will walk you through the standard deviation formula with some examples to help
you understand how it works.
The standard deviation formula is:
σ = √Σ(x-μ)^2/n
where σ is the standard deviation, μ is the mean, x is each value in the data set, and n is the
several values in the data set.
What Does Standard Deviation Tell Us?
Standard deviation is a statistical measure that tells us how spread out our data is. In other words, it
tells us how far our data is from the mean. A low standard deviation means that most of our data is
close to the mean, while a high standard deviation means that our data is more spread out.
Standard deviation can be a helpful tool for understanding our data, but it’s important to remember
that it’s just one measure of variability. There are other measures of variability, such as range and
interquartile range, that can also give us insights into how to spread out our data.
When to Use Standard Deviation
There are a lot of different statistical measures out there, and it can be confusing to know when to use
which one. Standard deviation is a measure of how to spread out a set of data, and it can be very helpful
in understanding your data. But when should you use it?
One common use for standard deviation is to understand how much variation there is in a set of data.
For example, if you’re looking at test scores, you might want to know how much variation there is from
the average score. Standard deviation can help you answer that question.
Another common use for standard deviation is to help you determine whether a set of data is normal or
not. A lot of statistical tests assume that your data is normal, so it’s important to check for normality
before running those tests. Standard deviation can be a helpful tool in determining whether your data is
normal or not.
So, when should you use standard deviation? If you’ re interested in understanding how much variation
there is in a set of data, or if you want to check for normality, the standard deviation can be a helpful tool.
Advantages and Disadvantages of Standard Deviation
There are many advantages and disadvantages of using the standard deviation formula. Some of the
advantages include that it is a very versatile tool that can be used in a variety of different situations. It
can be used to compare two sets of data, or to determine how close a set of data is to the mean.
Additionally, the standard deviation can be used as a measure of variability, which can help identify outliers.
However, there are also some disadvantages to using the standard deviation formula. One disadvantage
is that it can be difficult to calculate by hand. Additionally, the standard deviation does not always give
an accurate picture of the data set as a whole. For example, if there are outliers in the data set, the
standard deviation will be skewed and may not give an accurate representation of the data set.